Data is the heart of every industry, and this data makes up excellent graphs for businesses or companies for better performance. Scatter graphs are an especially essential tool for visualizing the selected data or emphasizing the data range. So, the importance of graphs like x-y is undeniable.
In our article, we will discuss how to make a graph on Google Sheets with the vertical y-axis with easy steps for you to follow. Also, you will find answers to frequently asked questions (FAQs). If you are wondering how to make an XY graph in Google Sheets using a data set, keep reading because you will find the answer!
What is an x-y graph?
XY graphs, also known as scatter plots or scatter diagrams graphs, are illustrations for numerical data. X-y graphs include one variable on each axis, and they are used to search for relationships between the data. In contrast to the pie chart, the xy graph’s points will follow a curve or a line.
At first glance, an x-y chart might be confusing; however, when you fully understand how to read them, they are really useful. If you want to determine whether there are correlations or patterns between two independent variables, an x-y graph would be the best option for you. It is a powerful tool to show the relatedness of two data sets.
How can I create an x-y graph in Google Sheets?
As we have discussed the definition and importance of the x-y graph so far, it is time to adapt the charts to Google Sheets. As you may know, Google Sheets is more than just a table program. You can use many tools on the sheet, and the x-y graph is just one of them.
As long as you follow the basic steps given below, you can easily create an x-y graph. If you want to learn how to make a scatter plot in Google Sheets, here are the steps:
1. Open the sheet
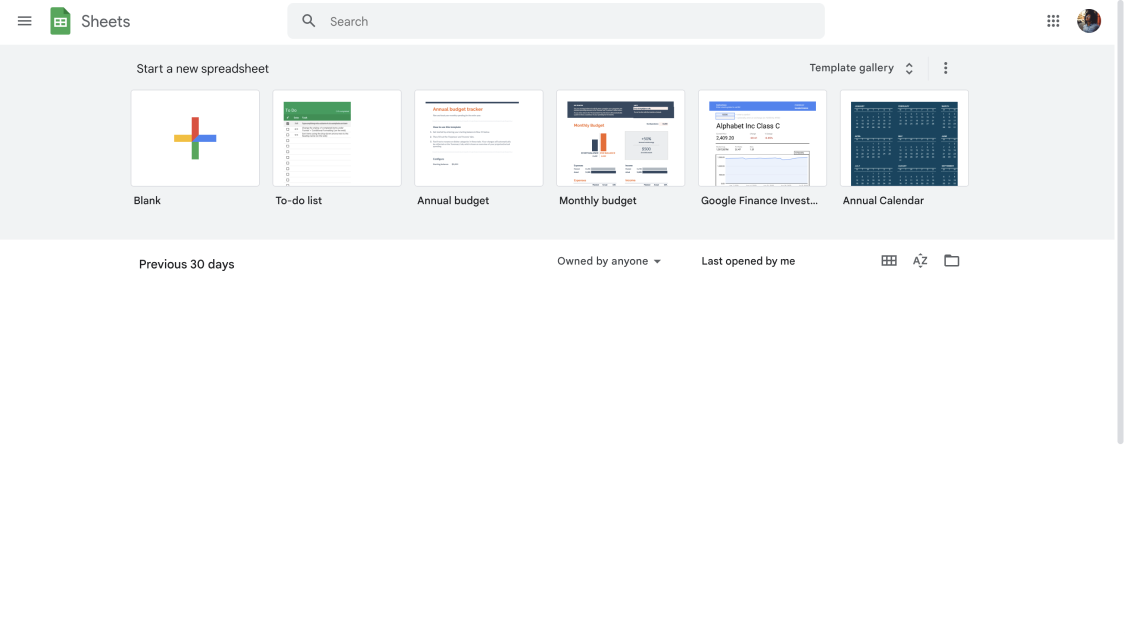
Google Sheets dashboard
As the first step, you need to log in to your existing Google account and open Google Sheets to view the particular sheet that you want to visualize via an x-y graph.

💡 If you are using forms.app, you can transfer your data instantly with Google Sheets thanks to the integration.
2. Choose your data
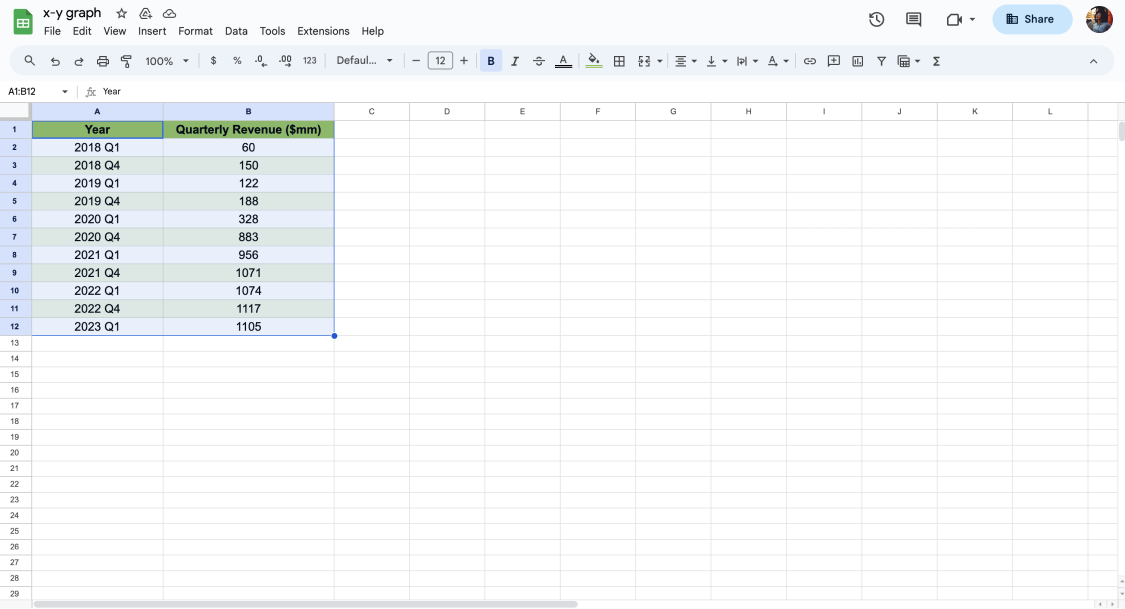
Select the data range for the graph
Once you open Google Sheets, you need to choose the data you want to graph. To choose your data, you can click on the cell located in the upper-left corner of the sheet. After that, hold down the Shift key. You should click on the lower-right corner of your data while still holding down the Shift key.
3. Create your chart
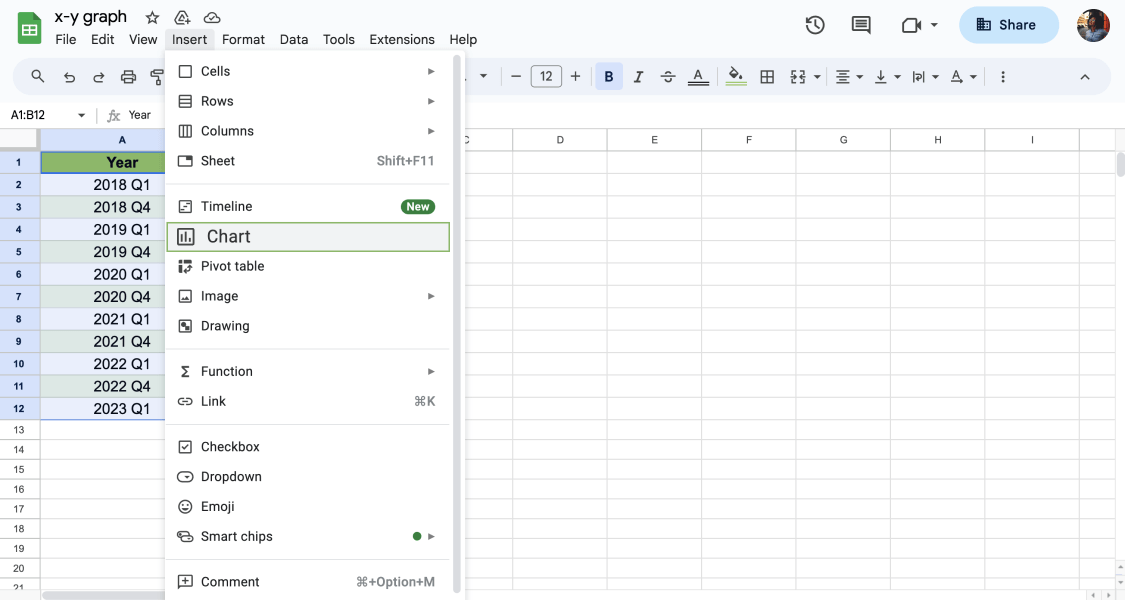
Click Insert then Chart to create your x-y graph
In this step, you will make up your graph. After choosing your data, you need to click on the Insert tab, and you will see the Chart option. You can simply click on the Chart tab, leading you to Insert Chart Menu.
Then, you need to select Scatter chart. When you simply click on Scatter, it will immediately create an xy graph with your data, also called a scatter plot.
4. Customize your x-y chart
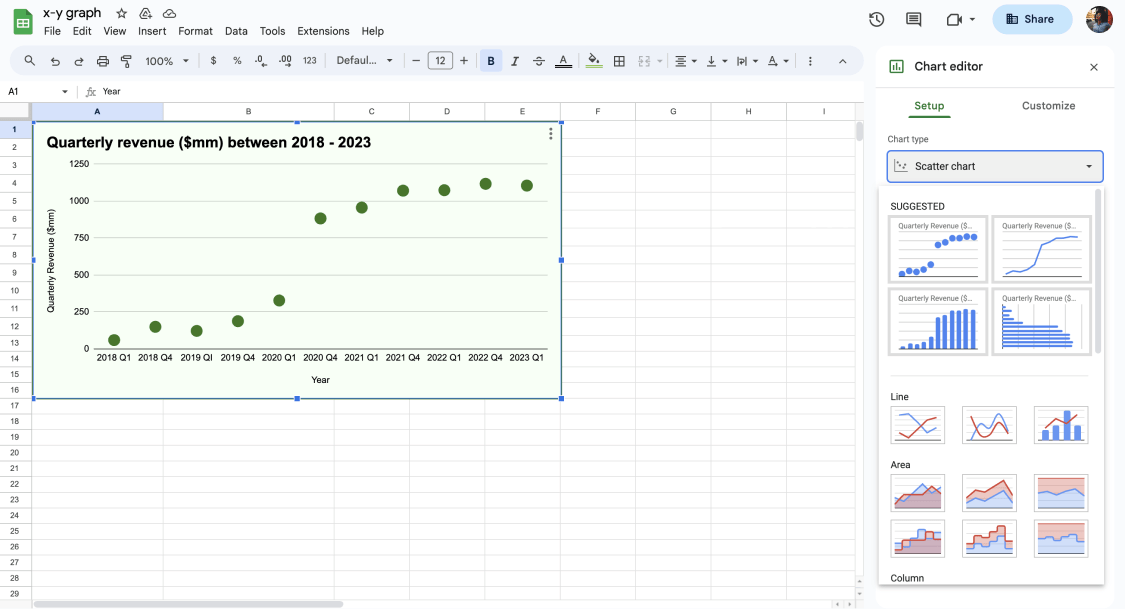
Edit your x-y chart under the Setup and Customize tabs
According to your preferences or needs, you can easily make changes to your x-y graph. If you want to change the look of the graph, you need to choose Customise from the Chart editor. In this drop-down menu, you can easily change the chart style, chart and axis titles, color, format, font, etc.

💡 If you want to seem more professional and want to create an x-y graphic with rich visual content, you should consider spending more time on customizing. You can change many aspects, such as color, title, font, shape, etc.
5. Share it
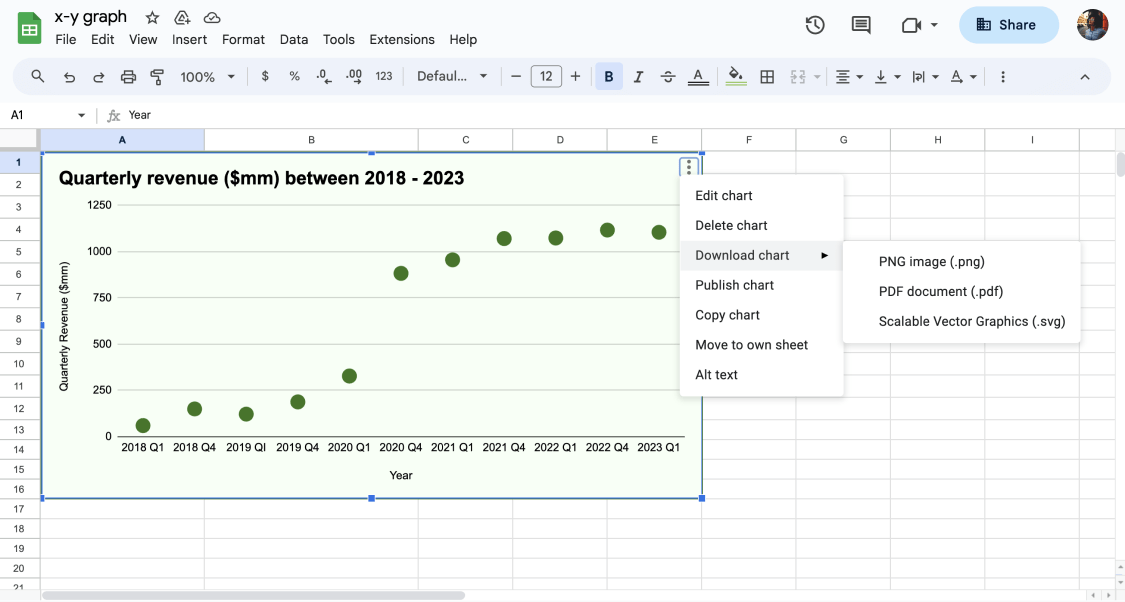
Download options for your chart
You can either download the chart as PNG, PDF, or Scalable Vector Graphics. Also, if you would like to, you can share the Google Sheet with your target audience.
Frequently asked questions about the x-y chart
In this section of our article, we will discuss some frequently asked questions, FAQs in other words. It is essential to know precisely what a scatter plot graph is to use them more effectively. You might consider looking at these frequently asked questions about the x-y chart:
As we have discussed so far, it is possible to create a scatter plot in Google Sheets. All you need to do is:
1. Open the sheet: Login to your Google Sheets account.
2. Choose your data: Click on the cell located in the upper-left corner of the sheet. Then, click on the lower-right corner of your data while still holding down the Shift key.
3. Create your chart: Click on the Insert tab, and you will see the Chart option. You can simply click on the Chart tab, leading you to Insert Chart Menu.
4. Customize your chart: Choose Customise from the Chart editor. In this drop-down menu, you can easily change the chart style.
5. Share: Download the chart as PNG, PDF, or Scalable Vector Graphics. Also, you can share the Google Sheet with your target.
X-y chart and scatter chart refer to the same things. An xy chart, scatter chart, in other words, is a visual representation that helps illustrate how two continuous variables (like x and y) are related in a data set.
Unlike xy charts, line charts are connected by straight lines and have trend lines to view the movements. So line charts help you to see increases and decreases better, while in x-y charts, points represent different two-variable data more messily.
There is more than one scatter plot type: U-shaped, linear, and exponential. Scatter plots have three types, and according to the correlation between the varieties, the look of the scatterplots will vary, too.
- U-shaped scatterplot: The graph’s points rotate and move in the other direction.
- Linear scatterplot: The scatterplot’s points almost exactly resemble a straight line.
- Exponential scatterplot: An exponential scatterplot has a curve that represents the data.
The answer to this question is simply no. Because a scatterplot shows the direction, shape, and intensity of two different data. Correlation is the level or strength of such links, like x and y. Although they are not the same thing, they are related. To explain the connection between the two data that is represented in the scatterplot, you need correlation.
Final words
To wrap it up, visualizing your data is a key point for businesses or companies. In particular, xy charts are ideal for your data analysis. Google Sheets enables you to create graphs and charts with the existing data on the sheet. In our article, we have discussed how to create an x-y graph in Google Sheets.
If you want to analyze your data better and have a clear display of collected data, you need to create xy graph in Google Sheets, and since you have read till here, you know where to start!
Şeyma is a content writer at forms.app. She loves art and traveling. She is passionate about reading and writing. Şeyma has expertise in surveys, survey questions, giveaways, statistics, and online forms.


 4 min read