Cluster analysis is a simple and effective tool to use in the business environment. It helps to better understand complicated quantitative or sometimes qualitative data with detailed modeling methods. Unlike other types of analysis, its main purpose is not to show or prove reasons; it is an auxiliary tool to better reveal what is happening.
In this article, to examine cluster analysis in-depth, what cluster analysis is will be the first thing to be explained. Then, it will be explained what methods/types you can use to conduct this analysis. Finally, you can get more precise information from the frequently asked questions section.
What is cluster analysis?
Cluster analysis is a multivariate data processing method used to show statistics. It aims to categorize or, namely, cluster entities.
It serves as a fundamental and pivotal stage in statistical data analysis as well as data mining. But it is also possible to use it in different areas. In particular, cluster analysis in data mining can specify both qualitative and quantitative features, showing its flexibility. That's why businesses always use cluster analysis as part of their decision-making mechanics.
The algorithm of cluster analysis is quite simple. It creates visible patterns by grouping similar entities together. However, with this feature, it is far from being a detailed analysis type. On the other hand, providing accurate data also has an important place here.
The more data is suitable for clustering, the more effective a clustering pattern is formed. Therefore, it would be a good idea to choose the methods and programs that are most suitable for your goal when performing clustering analysis.
Cluster analysis types
Choosing the right clustering algorithm can be a bit like trial and error. But if there is a solid mathematical reason to swear by one over the others, then it can be reasonable. And the important thing here is that what might work like magic for one set of data could fall flat on its face with another.
A variety pack of methods for cluster analysis below are presented to you, each bringing its unique aspect and approach to the table. It's like picking the right tool for the job and figuring out which one works with your dataset. Now, the four most well-known types are presented to you with cluster analysis examples:
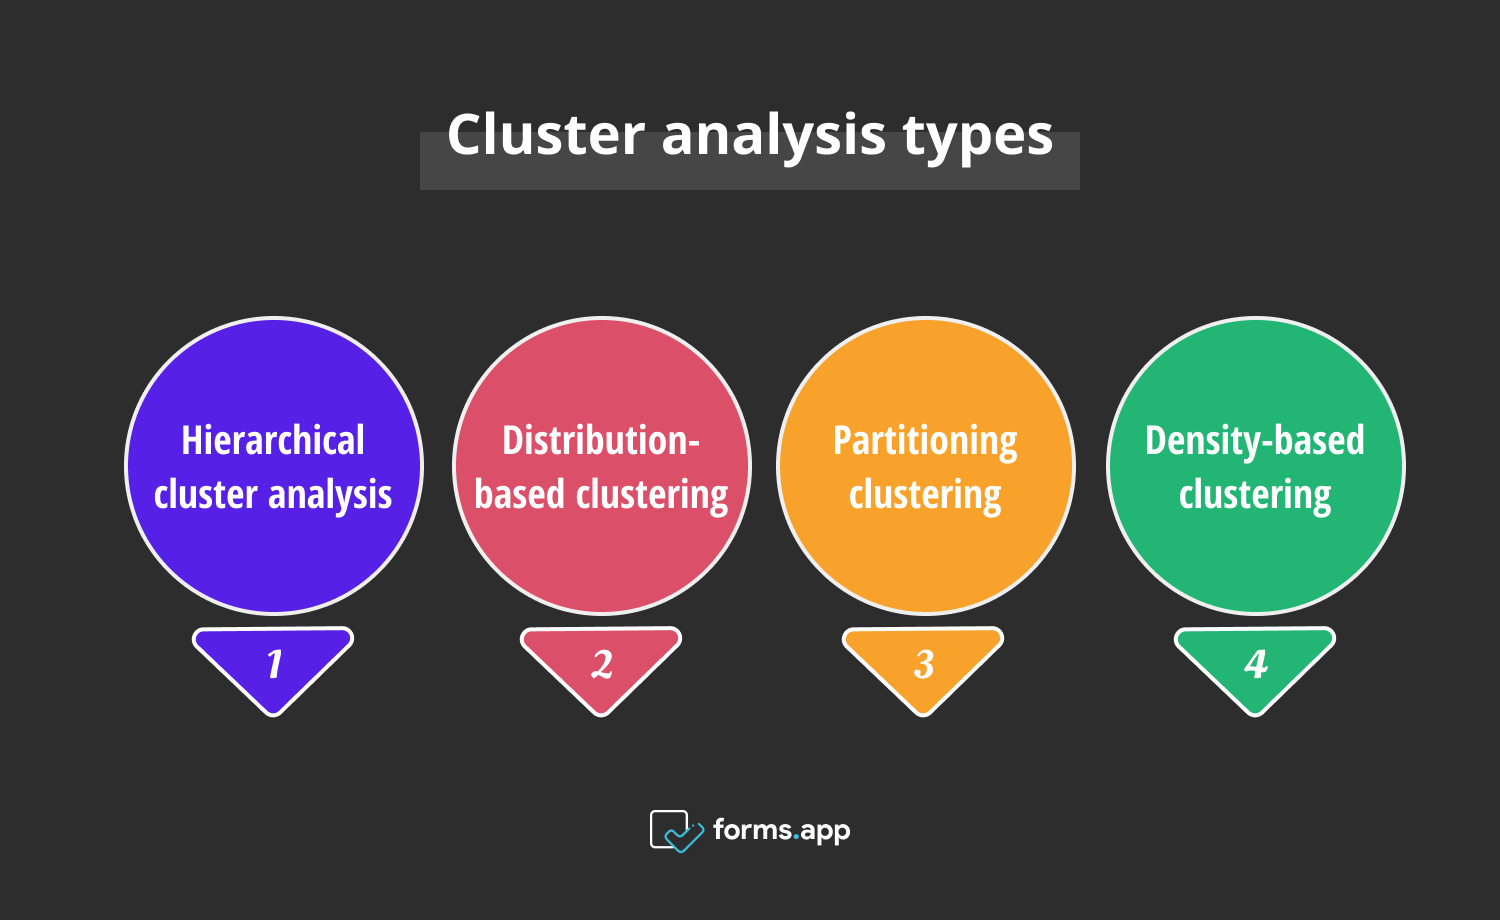
Types of cluster analysis
Hierarchical cluster analysis
In this method, the algorithm arranges the clustering of the provided data entities into a hierarchical order. The formation of clusters occurs by starting from a single cluster and dividing it into separate clusters.
The order of the hierarchy between these clusters may vary depending on the purpose of your classification and your modeling method. You can use mainly two different approaches for the hierarchical cluster:
- Agglomerative method: It is a bottom-up process that starts with a single entity and makes cluster groups from it.
- Divisive Approach: It is a top-down process that starts with entities in the same cluster and makes cluster groups by dividing them.
#Example of hierarchical cluster analysis
Imagine a tech company launching a new smart home device. The company wants to use hierarchical cluster analysis to understand how potential customers will respond to this new product. Data like customers' age, income, education level, etc., are collected for analysis.
Hierarchical analysis starts creating clusters accordingly. For example, a cluster such as young people and those with high incomes is formed, and this group may be exactly the target audience you are looking for.
Distribution-based clustering
This clustering model shows the distribution of interrelated data entities on the graph. Gaussian Mixture Models are a typical example of this type. Its area of use is to cluster structures connected to each other with complex structures more easily.
#Example of distribution-based clustering
Assume an internet provider company wants to understand customer churn patterns to intervene in it. First of all, there should be a dataset including information like overall or specific customer satisfaction, internet package preferences, commitment fees, and responses.
Then, you use the distribution-based clustering algorithm and wait for it to reveal the pattern between these values. For example, if the sales rate is low in a group that is contacted a lot to renew internet commitments, this and similar patterns constitute an example of current and future churn.
Partitioning clustering
Unlike distribution-based clustering, partitioning divides data entities into non-overlapping sections. Thus, each part it divides becomes a cluster. These clusters can be used to separate each other for a specific purpose. To implement a partitioning like this, the K-Means method is most commonly used.
- K means clustering: K-means clustering sorts your dataset into predetermined clusters. The algorithm randomly places cluster centers and begins to sort data entities around these centers. Then, the average of these centers is taken, and a new center is created. This process can be repeated many times, resulting in non-overlapping clusters.
#Example of partitioning clustering
Imagine a store in a retail sale scenario having hard times with its marketing strategy. Opting for partitioning clustering is the first step in market research. The machine learning algorithms will identify clusters like customer groups and market segments according to predefined partitions.
The resulting customer base patterns will help the business take better initiatives towards the target market. For example, if the store has a high-spender customer profile, it can strengthen its marketing by offering loyalty programs and promotions to this customer group.
Density-based clustering
Density-based clustering reveals similar groups by identifying the density of data points. In particular, its distinct difference from other types is that it avoids making the clusters a certain shape or size rather than creating a certain number of clusters. In this respect, it is useful in cases where data entities have an irregular order when forming a cluster.
#Example of density-based clustering
Suppose a business is trying to open new stores and wants to identify customer hotspots. It wants to enhance the quality of the new retail store by using a density-based clustering algorithm.
The algorithm can identify prime locations by distinguishing areas with intense customer flow, population demographics, and purchasing attitudes of this population. In this way, business owners have valuable data that they can use when making decisions about the store's opening.
Frequently asked questions about cluster analysis
The most frequently asked questions about cluster analysis are about when and how to use which clustering method. New users may sometimes encounter confusion regarding the interpretation of clusters. That's why the questions collected here aim to effectively unravel important nuances of interpretation and prepare you for the data analysis.
The four most common cluster analysis types are hierarchical cluster analysis, distribution clustering, partitioning clustering, and density-based clustering. Although all of them have more or less the same purpose, their clustering processes are different from each other.
Self-organizing maps, graph-based methods, and grid-based methods are also valuable methods that you can use in cluster pattern recognition.
As it is known, cluster analysis does not collect data. Instead, it creates a useful model by dividing your data into pieces and groups with the clustering algorithm. Therefore, you should prepare the data for clustering analysis yourself and pay attention to a few factors while doing this.
- Firstly, find the data that suits your purpose.
- Create a complete database in detail.
- Standardize the data according to the scale on which you will evaluate it.
- Adapt your data according to the clustering program you will use.
- Finally, have the program classify the data using the clustering algorithm.
It is true that cluster analysis stands out as a quantitative analysis type at first glance, but successful algorithms and well-prepared data preset show that it can also be used in qualitative analysis.
Analysis of cluster results is as important as data creation and processing. You can visually inspect groups (colored, grouped, or shaped) with the ease provided by modeling. Evaluating numerical data according to the method by which you created your modeling is the next step.
In this way, you determine the characteristics of each cluster group. If your data also contains qualitative features, do not forget to evaluate pattern relationships accordingly. As a result of these analysis steps, you will be able to use cluster analysis for your decision-making process.
No, cluster sampling and cluster analysis are not the same thing. Cluster sampling is a process used in the data collection phase. It is used to sample a large group of populations randomly. It isn’t obligatory in cluster analysis. On the other hand, cluster analysis is a data analysis method to identify similar patterns and group them together.
Conclusion
All in all, cluster analysis shows its power for revealing patterns using various modeling techniques. Its high dimensionality is a strong aspect of it. This article tries to show with examples that cluster analysis in marketing and data mining is beneficial for businesses. Whether it is qualitative insights or quantitative predictions, cluster analysis reveals the relationship between them through powerful data exploration.
That is, modern businesses benefit from this type of analysis to follow trends and reveal correlations that are not visible at first glance. So, you should understand and benefit from cluster analysis to improve your business in a world where data is as valuable as gold.
Atakan is a content writer at forms.app. He likes to research various fields like history, sociology, and psychology. He knows English and Korean. His expertise lies in data analysis, data types, and methods.