When gathering data for research purposes, you will always need to categorize it. Ratio scales are a trustable method for analyzing and interpreting your study results. A ratio scale applies to measures with a genuine zero value, making comparing variables such as age, gender, weight, time, and more accessible.
Based on the precision involved, ratio scale is the highest ranking of the four levels of measurement. This article will examine the definition of ratio scale in research, characteristics of ratio scale, examples of ratio scale, and when to use ratio scale with all details.
What is the ratio scale?
Ratio scale allows you to classify and rank your data in equal intervals. Researchers can identify and characterize the size of the issue since the ratio scale contains a real zero. You can use ratio scales to rank and categorize your data using equal distances.
The ratio scale describes the order and equal separation between two values. No negative values are involved, and the variables may be multiplied, divided, added, and removed. The ratio scale accepts both countable integers and unbounded values.
A ratio scale with a zero indicates that the variable being measured is not present. The ratio scale of measurement makes it easier to comprehend intervals, values, actual zero properties, and the final order of ratio calculations. The ratio scale is one of the most illuminating measurement scales.
Characteristics of ratio scale
The ratio scale has the highest ranking among the four levels of measurement as values can be classified, organized, have equal intervals, and take on a genuine zero at the ratio level. It is based on the precision required. You may classify and rank your data in equal intervals using ratio scales.
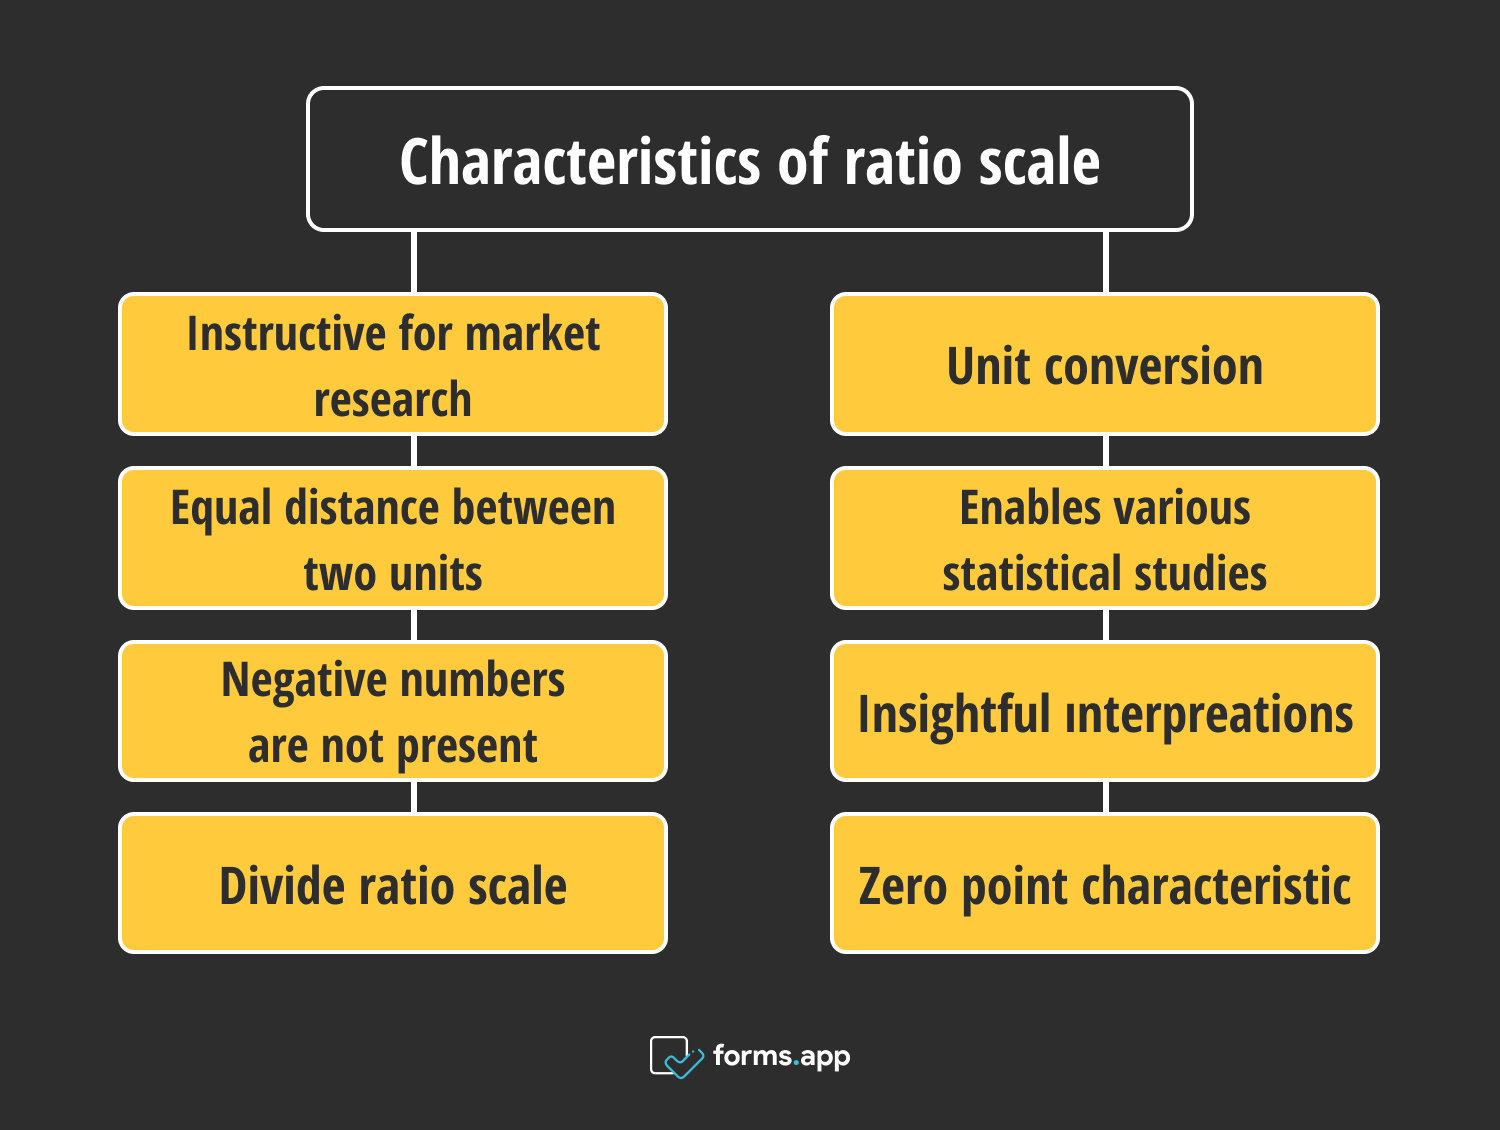
- Instructive for market research: The ratio scale is the most instructive of all for efficient market research. It can explain the equal separation between two adjacent numbers and their order. Additionally, the ratio scale's zero is significant, making distinguishing between "how much" amounts simple.
- Unit conversion: The ratio scale's units have several distinctive and essential characteristics. The ability to convert units is one of its main benefits.
- Equal distance between two units: A ratio scale has an absolute zero point, implying that “0” indicates the whole absence of the measured variable. Orders and the equal space between two units can be used to express the ratio level of measurement.
- Enables various statistical studies: Ratio scale data can be used for addition, subtraction, multiplication, division, and other mathematical operations. This makes it possible to do various statistical studies on the data.
- Negative numbers are not present: For anything to be measured on this scale, the researchers must first determine that it satisfies the interval scale requirements and possesses an absolute zero property.
- Insightful ınterpreations: Using ratio scale data, you may compute essential ratios of one value to another. This enables more insightful data comparisons and interpretations.
- Divide ratio scale: It is possible to divide ratio scale data into equal intervals along the scale, with each break having an identically significant difference.
- Zero point characteristic: A point zero feature of a ratio scale refers to a situation where the variable's value is entirely zero. Since there may be heat and cold at “0” degrees Celsius, ratio scale cannot measure the temperature. The majority of scientific variables, however, may be assessed using the ratio scale.
Ratio scale characteristics
Ratio scale examples
In a ratio scale, there is a concept of absolute zero, which denotes that zero indicates the attribute being assessed as absent. Measuring length, weight, time, the temperature in Kelvin, and the quantity of occurrences are a few examples of ratio scales. You can better understand the advantages of utilizing this style of measuring by giving concrete examples from the ratio scale.
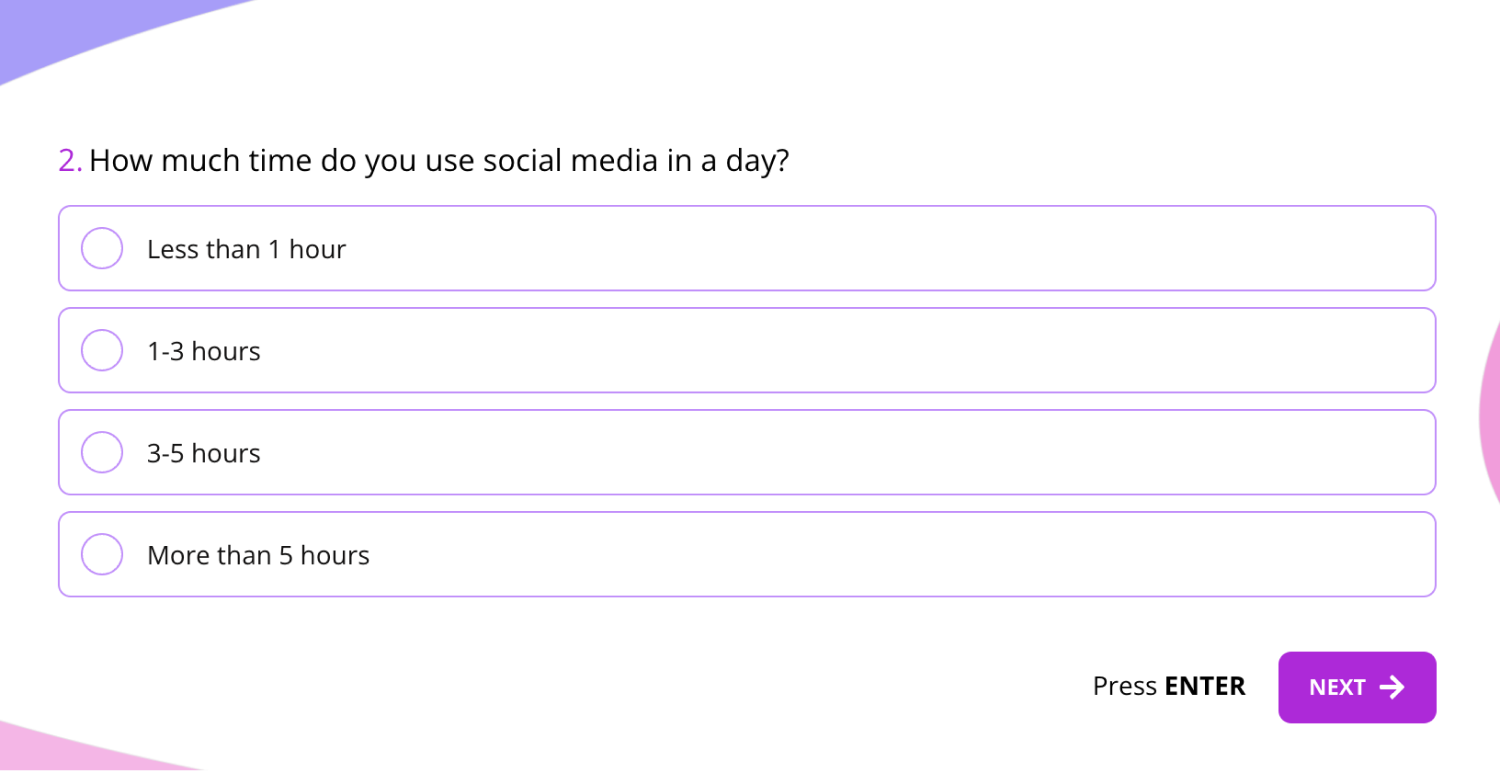
1. How much time do you use social media in a day?
- Less than 1 hour
- 1-3 hours
- 3-5 hours
- More than 5 hours
2. Please choose what age range are you in?
- Below 18 years
- 19-29 years
- 30-40 years
- 41-50 years
- 51 years and above
3. What height are you according to the metric system?
- Less than 4 feet
- 4 feet one inch to 4 feet 5 inches
- 4 feet 6 inches to 5 feet 2 inches
- 5 feet 3 inches to 6 feet
- More than 6 feet one inch
4. What is the range of your weight?
- Less than 50 kgs
- 51-60 kgs
- 61-70 kgs
- 71-90 kgs
- More than 90 kgs
A nominal scale question example
When to use the ratio scale variable?
When the data can be measured on a scale with equal gaps between each value on a numerical scale, the ratio scale variable is employed. As a result, the values may not only be sorted and categorized but also the discrepancies between the values can be measured and given significance.
The ratio scale variable is valid when mathematical operations must be performed and when the size of the value difference is significant. The ratio scale variable is frequently used in the following contexts:
- The ratio scale variable can be used for scientific investigations for exact measurements.
- You can use the ratio scale when measuring anything tangible, like time, temperature, height, or weight.
- Use the ratio scale when calculating ratios or rates, such as the revenue per employee or the miles per gallon.
- Ratio scale may be used for statistical analysis using terms like mean, median, standard deviation, or correlation.
- The ratio scale can also be used when examining financial data such as earnings or outgoings.
Ratio data analysis
After gathering ratio data, you may acquire statistical data that is both descriptive and inferential. Ratio data may be used for nearly all statistical tests since all mathematical operations are valid. We have shared the ratio data analysis below:
1 - Frequency distribution: You may arrange the data in a table or visualize it in a graph to determine the frequency distribution.
2 - Central tendency: As your graph shows, your data are reasonably regularly distributed. The mode, median, and mean are the three widely used measures of central tendency that may be used to determine where most of your data falls because there is no skew.
3 - Variability: Your data’s range, standard deviation, and variance show how dispersed it is. The variance and standard deviation are more challenging to calculate but also more meaningful than the range.
4 - Statistical tests: For statistical conclusions, you can pick the proper tests. Parametric tests work well for evaluating hypotheses when ratio data has a normal distribution. To use parametric testing, your data must adhere to several conditions.
Ratio scale vs. Interval scale
Understanding the statistical test you must apply is made more accessible by the variable’s degree of measurement. The degree of size is the approach taken to measure a variable. While the nominal and ordinal scales are categorical, ordinal interval and ratio variables are quantitative.
A ratio scale is a measuring scale that contains a genuine zero point in addition to all the features of an interval scale. An absolute zero fact indicates that the lack of the property being assessed is represented by a zero on the scale.
On the other hand, an interval scale is a measuring scale that lacks a genuine zero point but has equal distances between values. Therefore, zero does not indicate a measurement of a characteristic that does not exist.
The difference between the data has meaning in an interval scale. The ratio of the variables, however, is meaningless. While the interval scale lacks a valid “0 point”, the ratio scale does.
Final words
In conclusion, ratio scales are a particular kind of quantitative variable measuring scale. Any researcher can contrast the ranges or variations. A descriptive and inferential study of the data that marketers have gathered is made possible by the ratio scale.
You may collect valuable data and develop insightful insights to assist you in making decisions using the appropriate measuring scale. This article has explained the ratio scale in statistics, examples of ratio scale survey questions, interval and ratio scale comparison.
Sena is a content writer at forms.app. She likes to read and write articles on different topics. Sena also likes to learn about different cultures and travel. She likes to study and learn different languages. Her specialty is linguistics, surveys, survey questions, and sampling methods.