Data, data, data... It is something that all large or small businesses, organizations, and institutions need to take solid steps. Data is a part of life; each activity can be the subject of data analysis. Unfortunately, it is not that easy to collect, organize, and make sense of any data. Objectives, processes, and limitations are among the elements that determine data analysis. But you don't need to worry because this detailed article will give you various information about data analysis.
The article will first start with its definition and importance in order to get to know the data analysis thoroughly. Then, when you should use it, its types and methods will be explained. Finally, the article will end with examples. Now, start with the first title!
Let’s start with the basics: What is a data analysis?
Data analysis is a process that systematically examines any data, reveals patterns, and derives insights accordingly.
This process consists of data collecting, editing, analyzing, and interpreting steps. Analyzes can be qualitative or quantitative, depending on the purpose of the research and the nature of the data.
There is no single method for performing data analysis. There are various techniques (data mining, machine learning, etc.), software, and AI for processing raw data. The purpose of all these processes is to ultimately make the data available to provide usable and actionable information.
Importance of the data analysis
We asked the what question, and now the next question is why. Why should you analyze data? What is its importance? Businesses and organizations constantly improve themselves thanks to data analyses. So what was it helping them with?
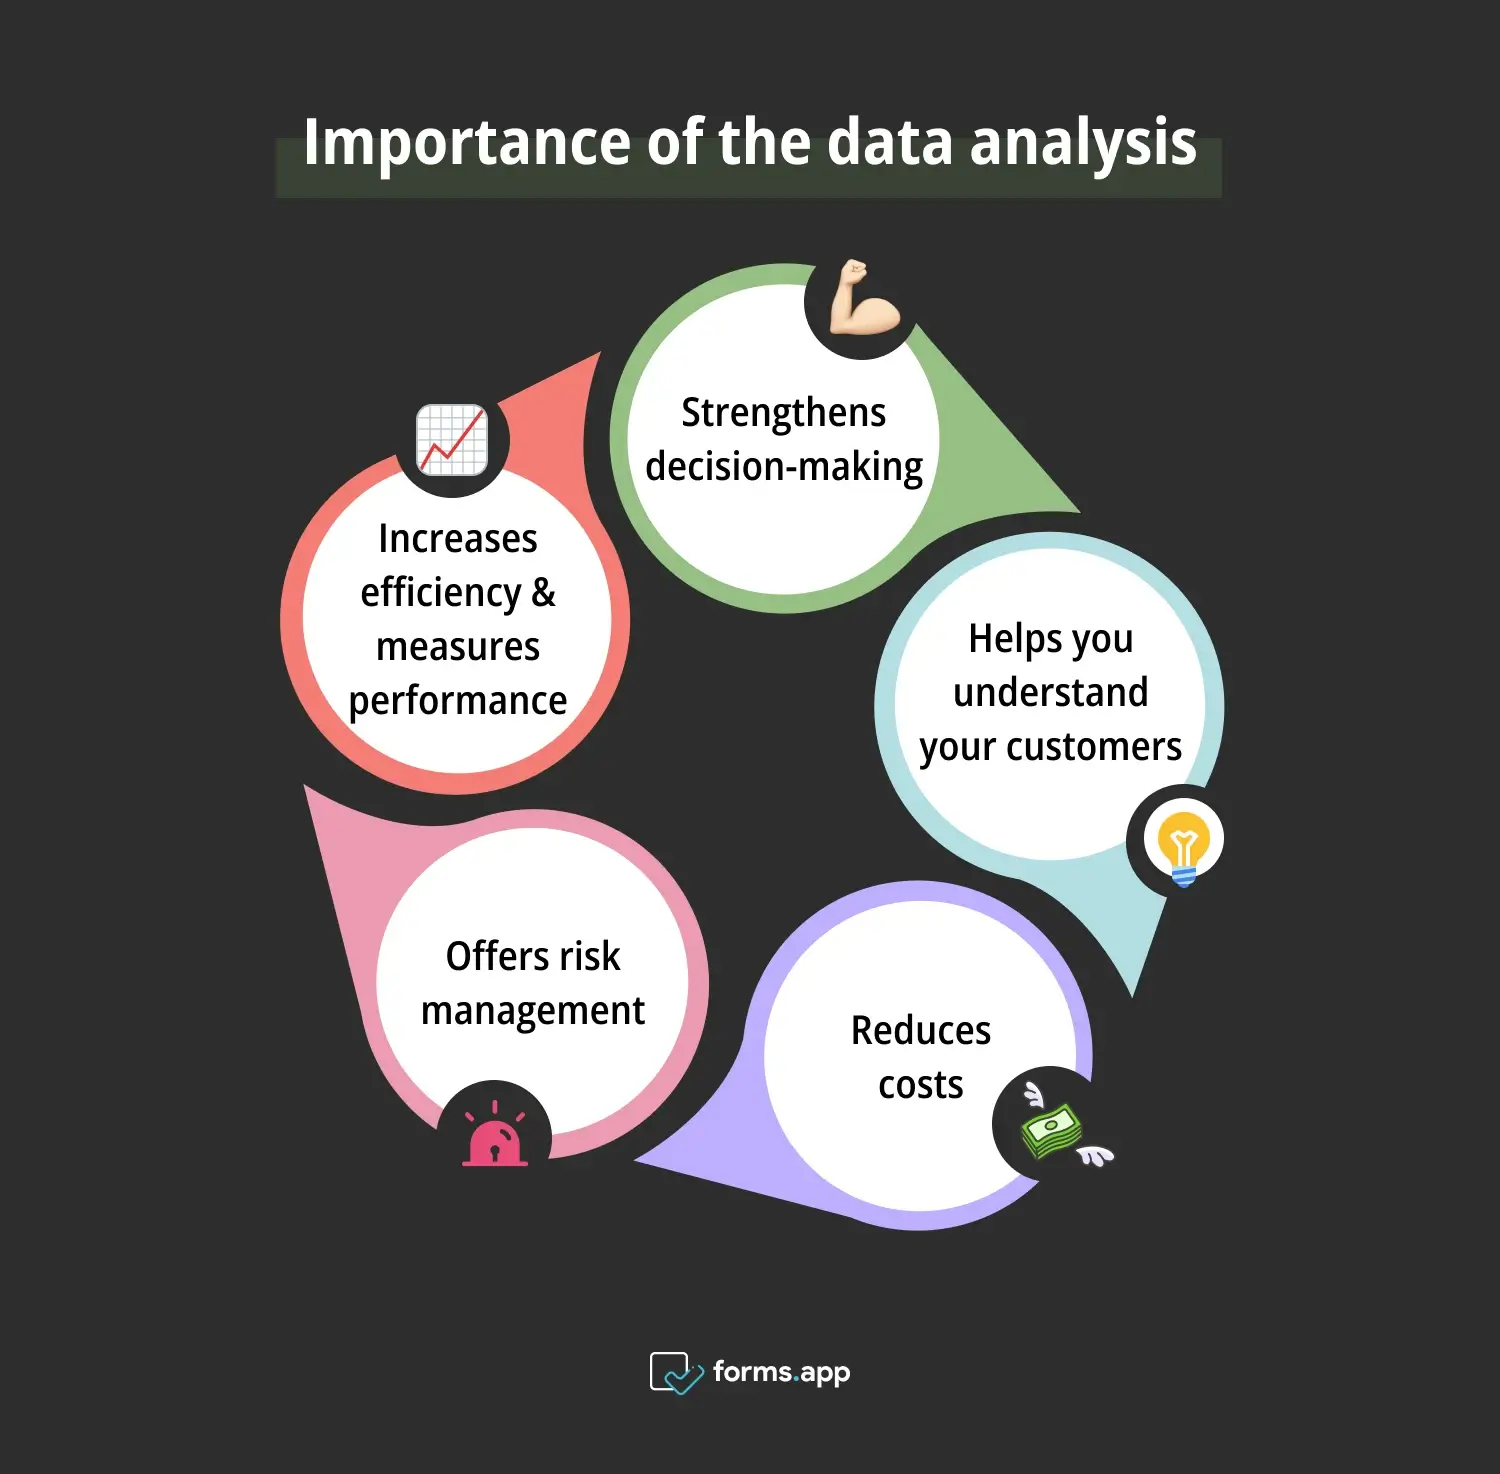
Significance of the data analysis
💪Strengthens decision-making
Data analysis helps you come up with ideas supported by statistical evidence. Use it to make decisions instead of leaving things to chance and intuition. You can support all your decisions with facts, big or small, whether it is the decision to open a new branch or a weekly status evaluation of your business.
💡Helps you understand your customers
The best way to obtain deep insights into your customers' preferences, behaviors, needs, complaints, and requests is data analysis. You can provide better service to your customers with the data you systematically obtain from them through surveys, interviews, or comments. For example, data analysis provides a comprehensive report to recommend unique products and services to them, group customer profiles, improve your products and services, and strengthen your marketing strategies.
💸Reduces costs
An analysis of any research subject you do for your business actually helps reduce costs. For example, if you analyze data to provide better service to your customers, this will have positive reflections not only on your customers’ experiences but also on your business. Since analysis is useful in spotting mistakes and deficiencies, it helps you use your money and resources economically.
🚨Offers risk management
It is important to take risk precautions, but when you encounter risks, it is necessary to eliminate these risks immediately and, if not, to mitigate them as much as possible. If you have already been in a risky situation, it happened as a result of an unexpected event. This unforeseen risk could have been predicted if you had done data analysis. However, even in this case, data analysis to reduce the risk allows you to understand the situation and make the necessary decisions.
📈Increases efficiency & measures performance
Data analysis is used to find inefficiencies in your business, reduce workload, and organize similar operations. You can access real-time metrics by monitoring the performance of your business through continuous data analysis on a weekly, monthly, and annual basis. This way, you can identify where and when there are deficiencies.
When to use the data analysis
Some key times for your business and organization may even require you to make data-driven decisions. If you want to know what these situations are, you will find a few listed below:
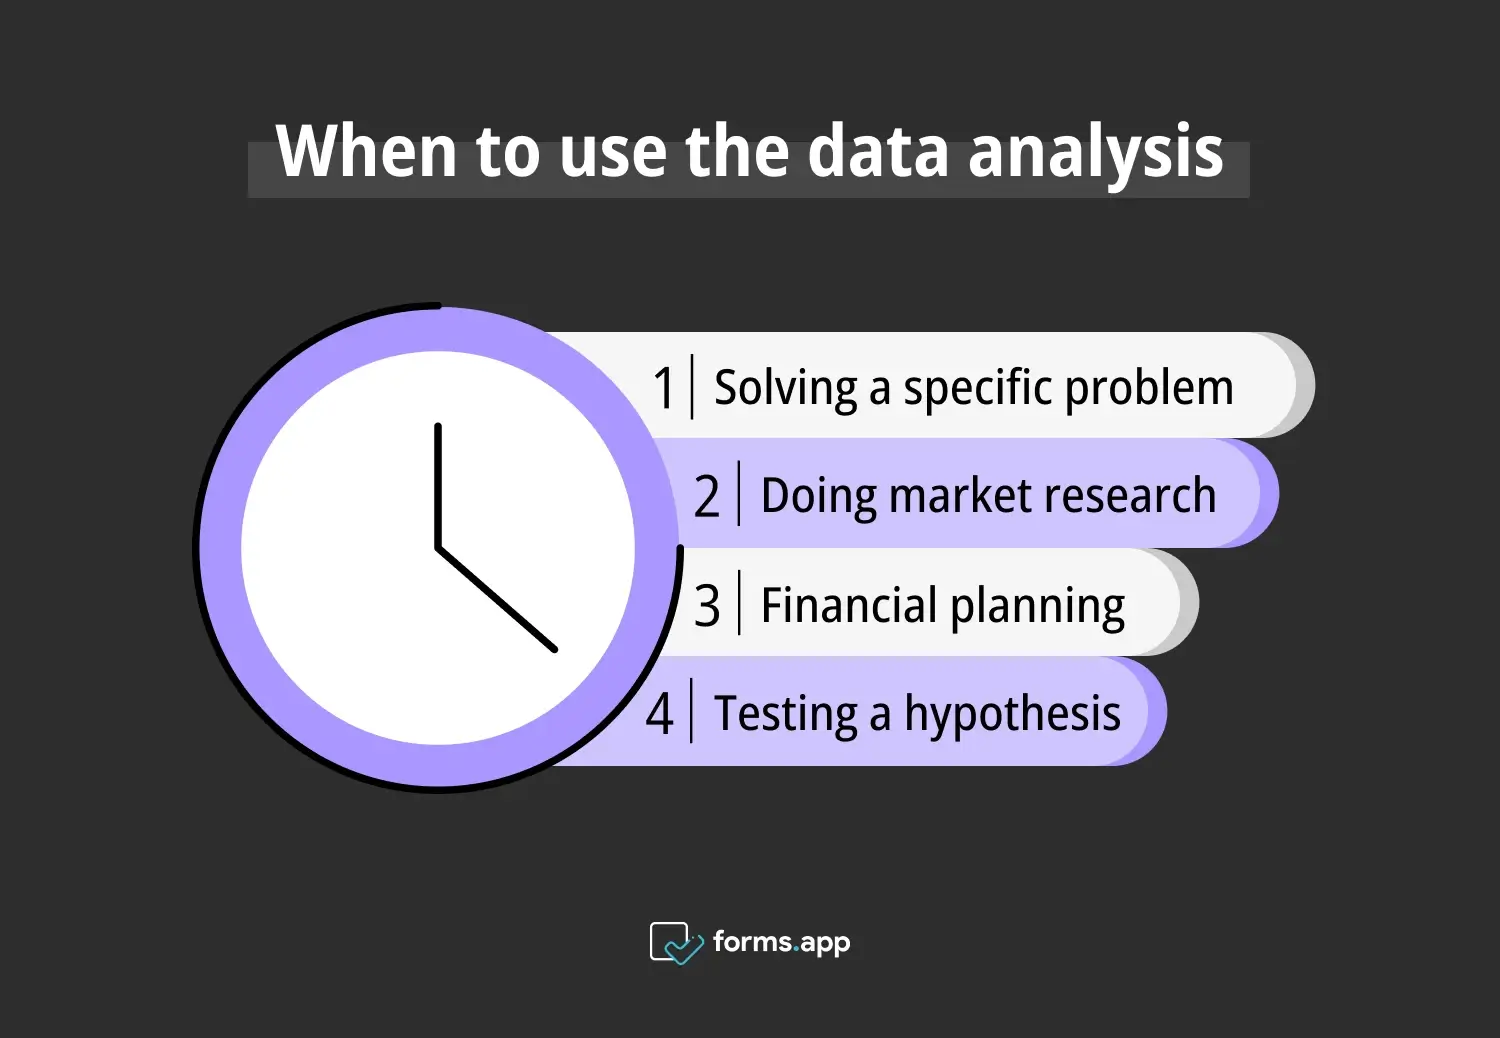
Correct times to use the data analysis
⏰Solving a specific problem
When data analysis is done in the proper steps, it gets to the root of the problems and reveals what causes them. For example, you can collect data through surveys to understand why your new product is not popular and find out what your customers do not like about this product.
⏰Doing market research
Data analysis is always beneficial, whether it is in the current market or when entering a new market. If you are going to launch a new product, do not attempt such a big project without doing market research. First, you need to understand the competing companies in the market, and then you need to examine the market situation, customer profile, and preferences.
⏰Financial planning
Constantly analyze the financial reports of your business and, if possible, different companies. Find out what you allocate your budget to with statistics. Thus, you need data to make accurate planning when making financial decisions in the future.
⏰Testing a hypothesis
Data analysis also provides a suitable environment for conducting scientific activities. This is needed to validate theories and strengthen research. Therefore, data analysis lends a helping hand to many different disciplines that want to test a hypothesis.
Data analysis types
In fact, there are dozens, perhaps hundreds, of different types of data analysis. However, although it varies more or less, it can be said that they are grouped around the five most commonly used main types of analysis. These are as follows, in order of simplicity to complexity:
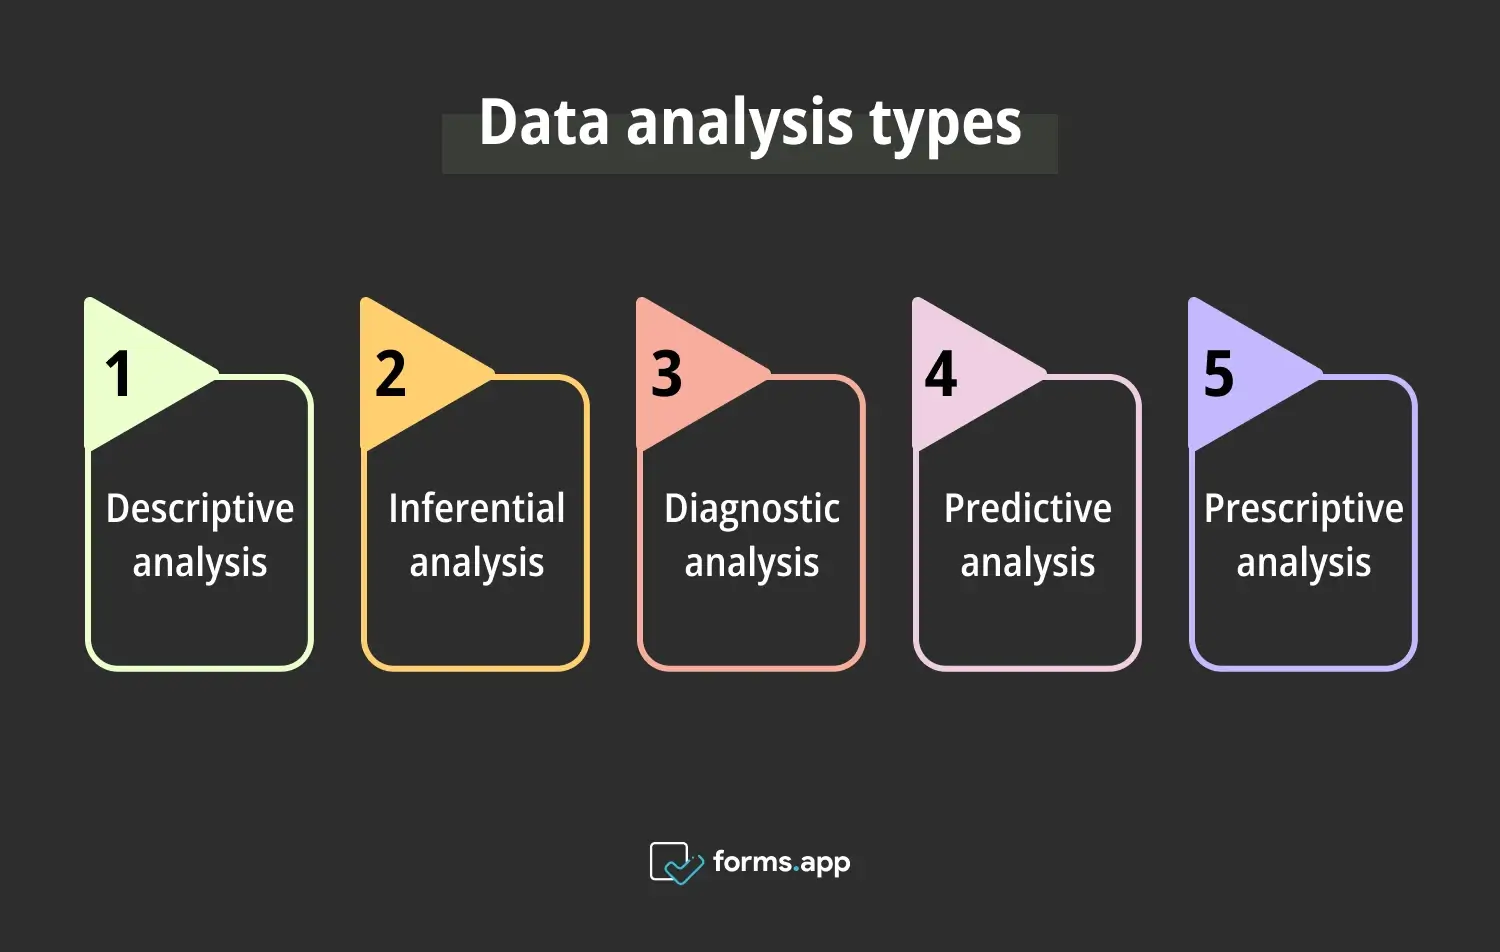
Data analysis types
a. Descriptive analysis
Descriptive analysis is a data analysis method that uses historical data to illustrate and explain a particular condition. It is the most fundamental analysis for summarizing data and only uncovering patterns and relationships.
Thus, it is one of the fastest ways to understand what has happened. However, researchers may need to make manual adjustments due to its simplicity. Overall, descriptive statistical analysis serves as a precursor to more in-depth analyses like diagnostic or predictive analysis, which will be explained soon.
b. Inferential analysis
Inferential analysis is a prediction method based on a large amount of data to make generalizations. It tries to reveal what predictions can be made based on the sample results and the relationships between trends.
c. Diagnostic analysis
Diagnostic analysis is a data analytics method employed by businesses and organizations to determine why a particular situation occurred. It reveals why a problem or situation shows certain patterns by providing a more detailed analysis than descriptive analysis. The results of the analysis are often easy to visualize, so you can effectively perform it using various software and tools.
d. Predictive analysis
Predictive analysis is a data analysis method used to understand future trends using data from real-life examples. It mainly employs statistical modeling and machine learning algorithms to derive actionable insights. It has a wide range of usage areas, from weather forecasting to investment strategies. It can be categorized as a quantitative analysis rather than qualitative because it deals with primarily measurable numerical data.
e. Prescriptive analysis
Prescriptive analysis is the final research method in data analysis. As a higher step of predictive analysis, the interpretation of the analysis is included, often with the support of artificial intelligence. Overall, it includes all the steps of a proper data analysis, starting with data collection, classification, analysis, and interpretation.
Methods of the data analysis
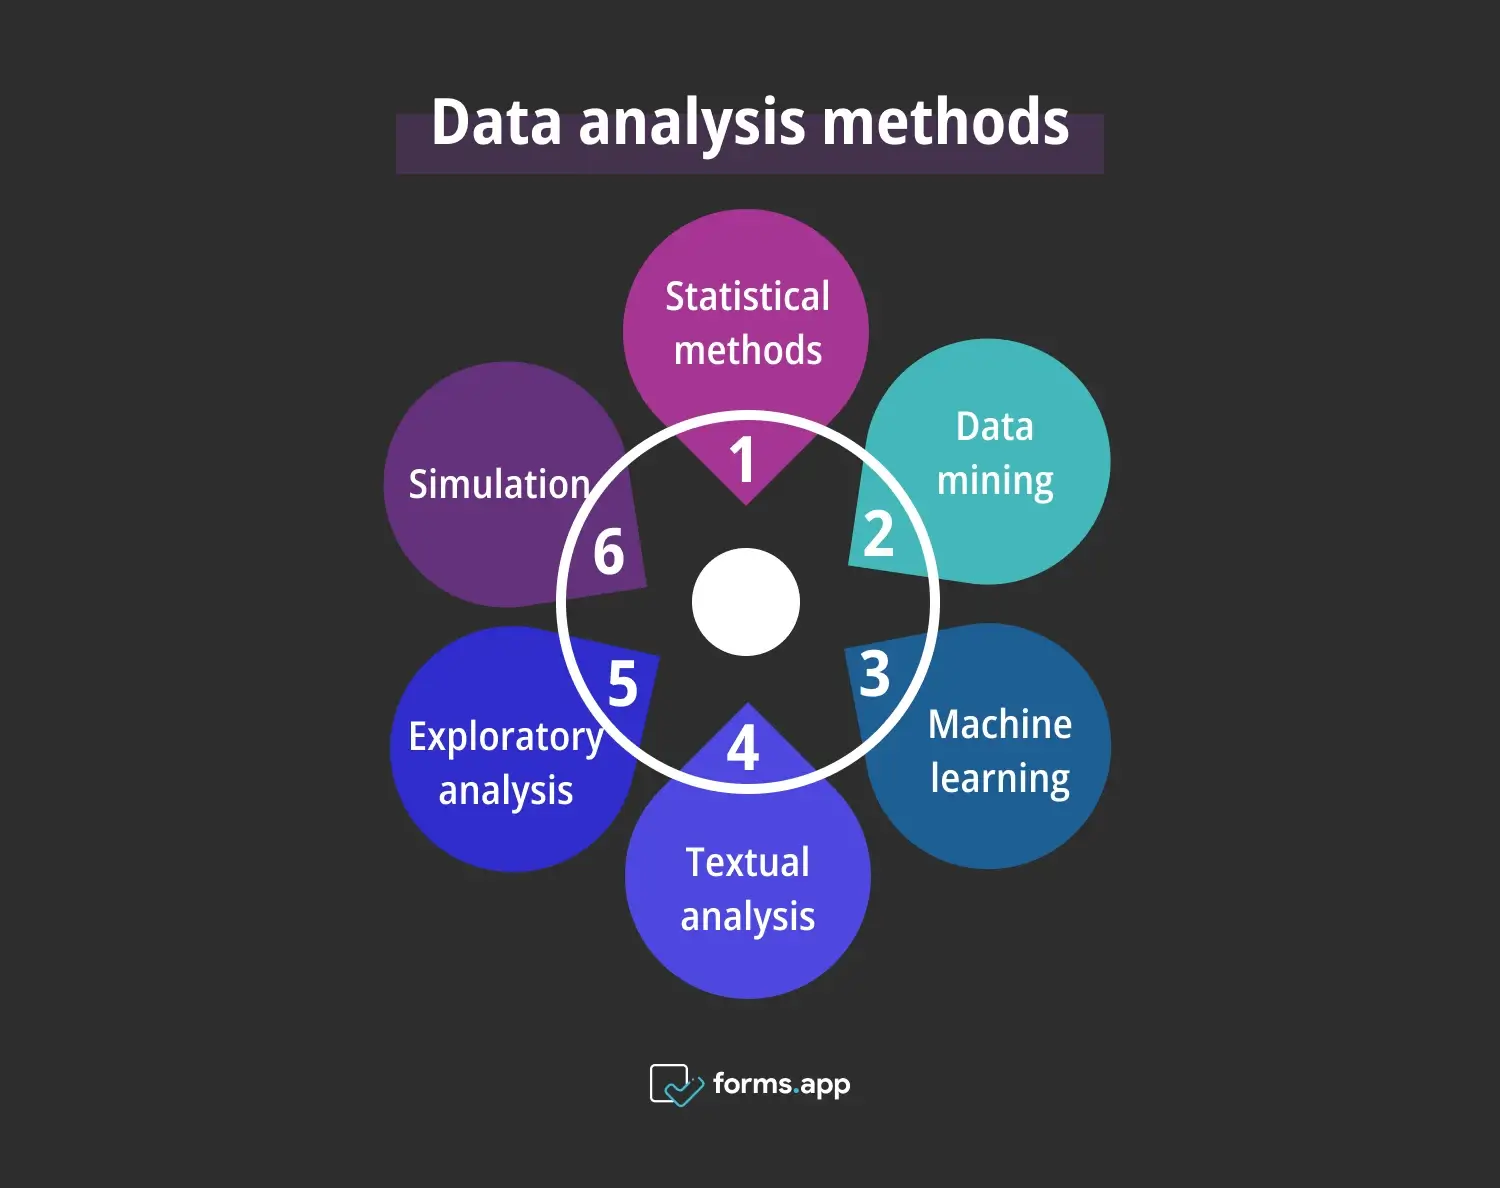
In order to fully perform data analysis, you must follow appropriate methods that will guide your research. The methods vary widely, some covering very basic needs while others are quite sophisticated. But no matter what method you use, the aim is always to transform raw data into valuable information. Now listed here are a few of the most used data analysis methods:
Data analysis methods
1. Statistical methods
Data analysis can be done with the most basic statistical techniques. These reveal the characteristics of an existing data set with mean, median, mode, standard deviation, and variance. Mean or average represents the sum of all values in a data set divided by the number of values. The median is the middle point of a data set.
When the values are listed from smallest to largest, it is the value in the middle. The mode is the most recurring value in a data set and can be found one or more times. The standard deviation shows how much the values in the dataset deviate from the average. A low deviation means that it is good, while a high deviation means that it is away from the average. Lastly, variance measures the distribution of values in the data set.
2. Data mining
Data mining is a method used to categorize data and create value and context for it. In particular, it is a great way to produce advanced information to further reveal data categories and patterns and show the relationships and dependencies between them.
💡Artificial intelligence and machine learning are mostly used for this. It is a method you can choose to produce fast and effective solutions to your problems.
3. Machine learning
Machine learning(ML) and artificial intelligence(AI), which are not covered separately, are great methods that enable data analysis to be done very quickly and effectively. Nowadays, companies allocate more of their budget to ML and AI and benefit from the insights they provide. Once sufficient data is provided, these algorithms continuously improve themselves and become capable of making descriptive or predictive models.
4. Textual analysis
Text mining or text analysis is a method focused on examining the structure of any spoken (scripted) or written text. It is used to classify data cleanly, reveal concepts, and create insights in the light of this information. This method actually has a wide range of techniques, a few of which are content analysis, thematic analysis, narrative analysis, and discourse analysis.
You can easily and systematically examine both quantitative and qualitative data with appropriate techniques. Text analysis is used especially in communication studies, sociology, and psychology. Apart from this, businesses also benefit from it to understand their customers better.
5. Exploratory analysis
As its name suggests, exploratory analysis is a method used to make sense of and explain the dataset. It aims to reveal unpredictable data and determine what information can be produced from this data. In fact, this method creates a bridge between analysis types and methods. It cannot be called a complete analysis on its own nor a complete method because it is used to initiate higher-level complex analyses.
6. Simulation
Simulations are an indispensable part of scientific research. Businesses have followed these scientific developments and adapted simulation methods that can be useful in data analysis to their own fields. Perhaps the most well-known of these is the Monte Carlo simulation.
This simulation creates a data model using random sampling and reveals the risks and unforeseen situations that businesses may face in the future. This computational technique is very important because it predicts more scenarios (maybe a hundred, maybe a thousand) than can be done by human hand.
How to use the data analysis in your business
Every business, no matter how small or large, takes care to perform data analysis due to the benefits it provides in decision-making and growing their business. You can perform data analysis by following these steps to bring your business to a better level:
1. First of all, you need to have some purpose. This may be a problem that you mostly want to overcome. You can find the answers you need by asking the right questions. For example, to understand the decrease in customer satisfaction in your business, you must first look at the reasons for this.
2. You have to find and collect data that is in line with your purpose. This data can be found from various sources. For example, businesses often use social media comments, complaints and requests, financial records, surveys, and interviews. The size and reliability of this data will profoundly affect the outcome of the analysis, so scrutinize it carefully.
3. Not all collected data is suitable for processing and obtaining results. Eliminate deficiencies and redundancies and classify them manually or with data analysis software and tools.
4. Choose from the data analysis techniques listed above or others not listed here. These techniques will help you visualize your data, reveal relationships, and develop strategies. For example, if you are researching market trends, you can examine which product a or b is more preferred by comparing its features.
5. Ultimately, you need to interpret the data based on the results. This step may vary depending on the analysis technique you choose. Researchers can do it manually, or they can use artificial intelligence to do the job. Now, you can move your business to a good position by taking more solid steps based on these insights.
Examples of the data analysis
Data analysis is actually something that can be applied to every part of our lives. Every action you take and every word you say is actually data. Saying everyday expressions like "I didn't like this movie" or "The bill this week was $100." can be a crucial data element for the research in question. Now let's try to reinforce this with some examples below:
Situation A: You have a company and want to increase your online presence.
Process: Many data analysis tools can reveal statistics of users who visit your website. Apart from this, you can also examine successful websites and review your shortcomings. For example, even data such as how many of your page visitors find the user interface easy or how many minutes they spend on the site provide very important insights. Thus, you can make your website more visible with the data results and raise your website to a user-friendly position.
Situation B: As a local coffee shop, you want to provide better service to your customers.
Process: First of all, you need to collect data from your customers both through interviews and surveys. Telling them about their own experiences will yield more useful results than your observations. Of course, you will need different methods to collect and analyze this data.
For example, while a qualitative analysis is required to examine subjective comments, you may need a quantitative analysis to examine the price scale. As a result, you can grow your business by evaluating the best options for your shop and your customers.
Final words
In summary, data analysis is an essential tool that empowers researchers to extract valuable insights and make well-informed decisions. This article has been prepared to provide you with a comprehensive perspective on data analysis. It can be seen as a data analysis tutorial.
The correct and practical analysis of data is essential. This guide, with detailed explanations and data analysis examples, can help you manage enormous amounts of data. Especially if you own a business, read this article to better understand data analysis and find solutions to their needs!
Atakan is a content writer at forms.app. He likes to research various fields like history, sociology, and psychology. He knows English and Korean. His expertise lies in data analysis, data types, and methods.


